I’ve been working hard to add more ‘color’ to the charts my kiddos and I make. My students have really responded to this. We discuss, all the time, how the brain thinks in pictures and that illustrating and diagram-ing in science, social studies, and EVERYTHING can really help learning ‘stick,’ so it was only a matter of time before I had to start drawing, too! While my artistic skills leave much to be desired, it has been a bonding experience for my students and I. They know I am taking a risk every time I try to draw, and we laugh together at the results, someone usually offers a stretched compliment, and it makes for a memorable experience. Here are a few charts we’ve made recently.
Here is “What we THINK we know about the Earth, Moon, and Sun.” (below)

5th Grade Food Chain–I always label my pictures so they are easier to understand! (below)

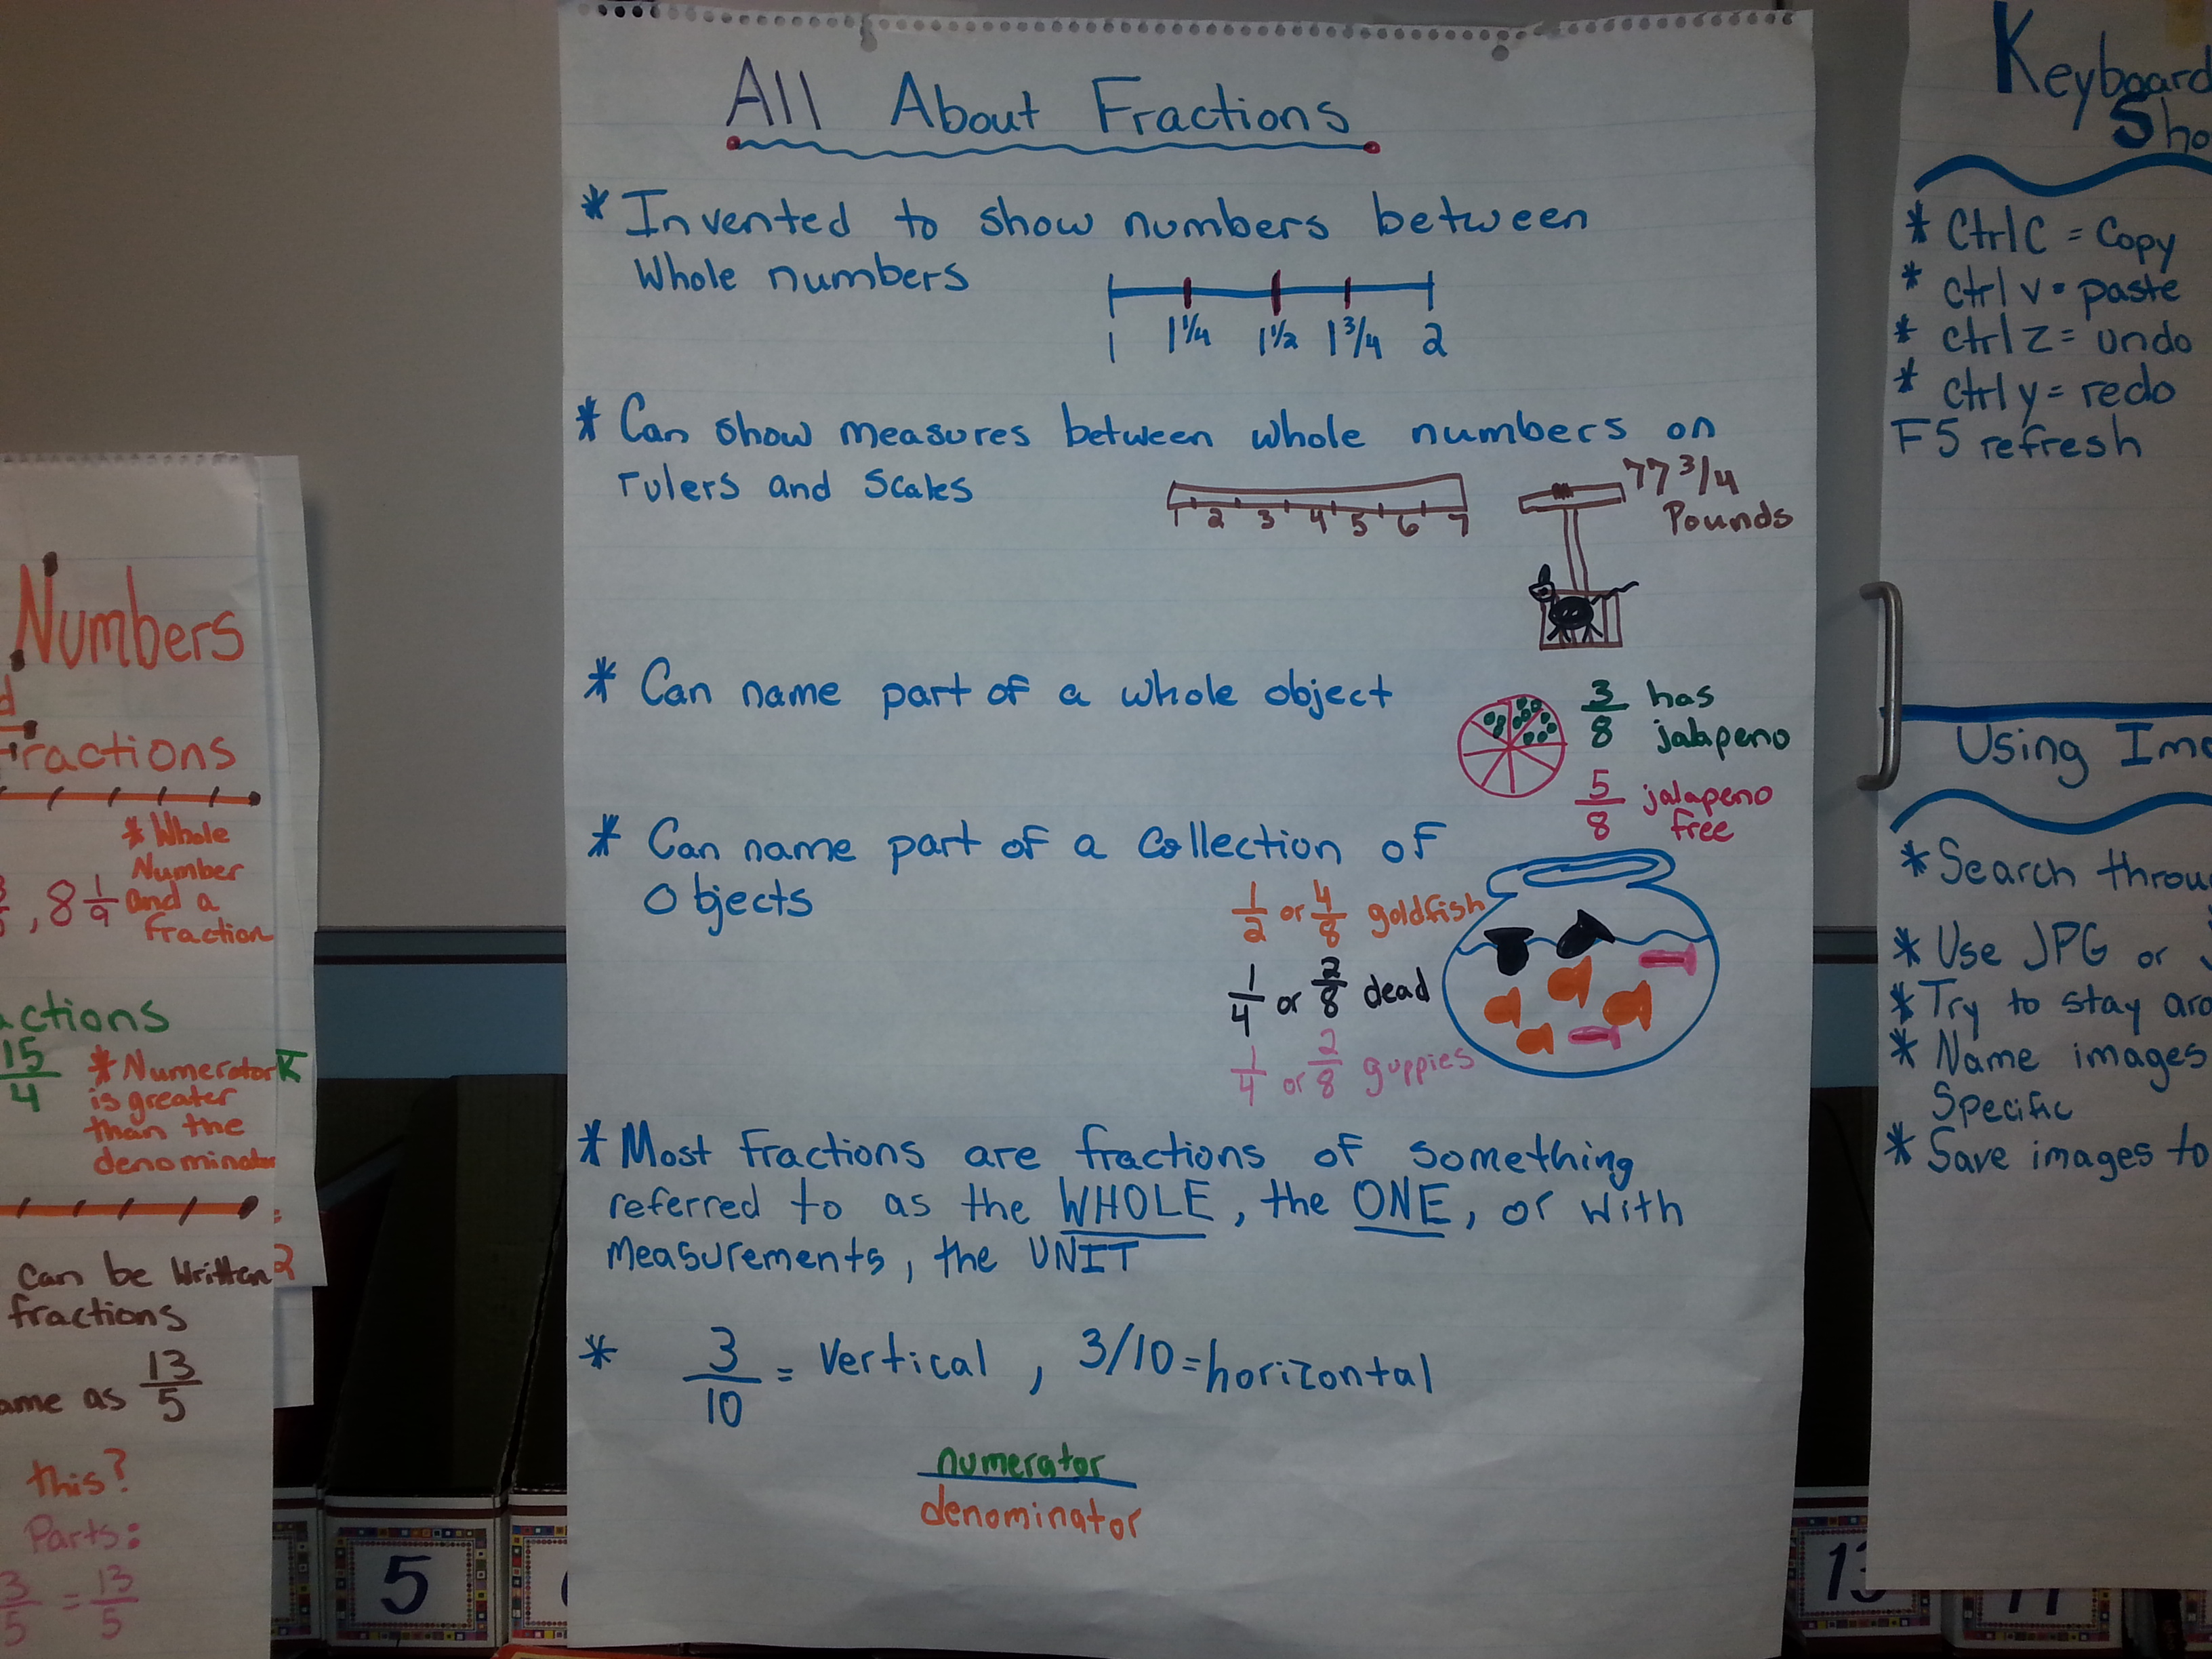
Before we delved into fractions, we discussed what they were and how they are used. (below)